Field notes: the week the yard answered a question the port's stats couldn't
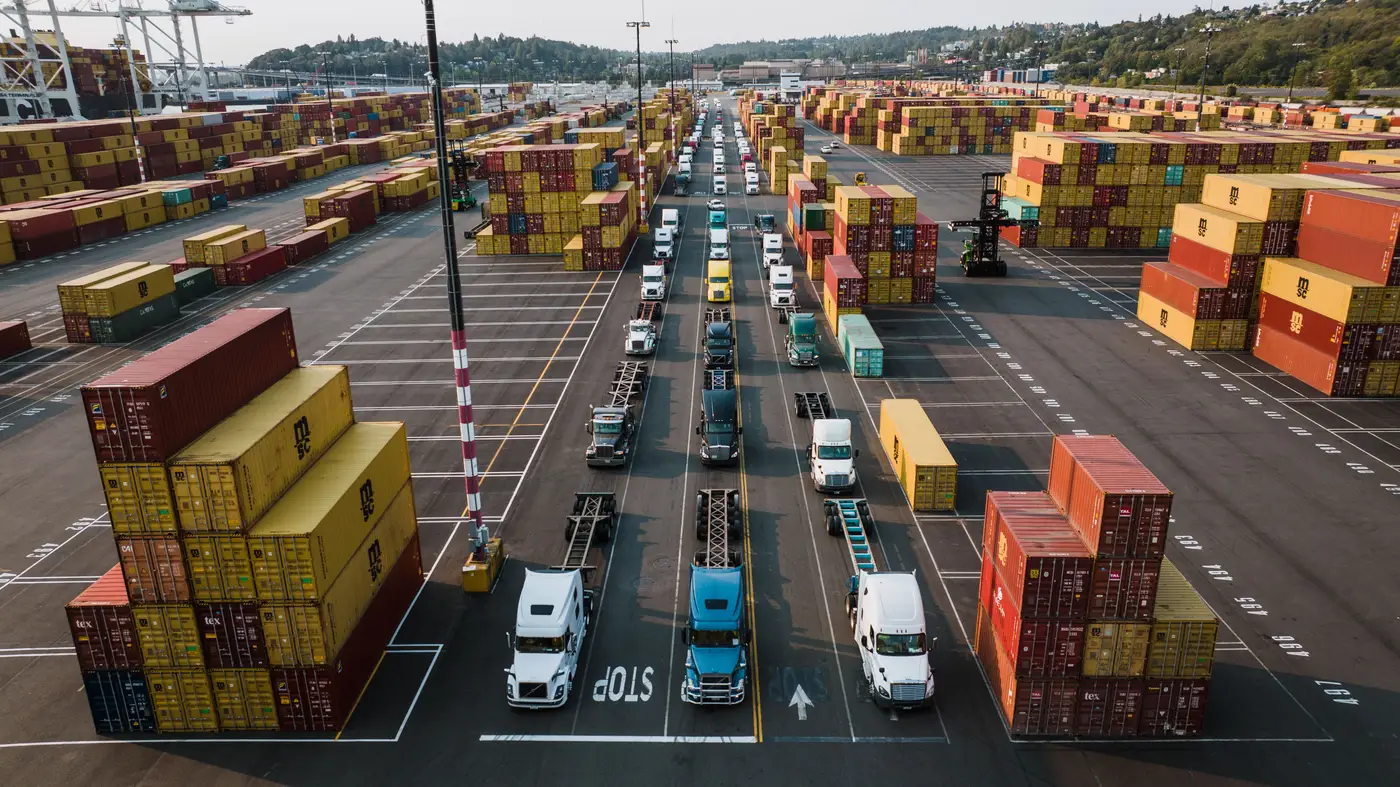
There's a particular kind of Tuesday that happens at every terminal planning desk sooner or later. A line's ops manager calls asking why their vessel got pushed back two days, the berth window looks fine on paper, AIS shows nothing unusual queued offshore, and the only honest answer is "the yard's full, go look." Except nobody can go look, not properly, not across every block, not without walking it.
This is the gap analysts live with. The port's own monthly throughput release tells you what moved last month. It doesn't tell you what's sitting there this week, stacked four and five high in blocks that were supposed to be cleared by Thursday. AIS tells you which ships are coming and going, which is useful for berth scheduling and useless for yard congestion, because a box that's been sitting dockside for eleven days doesn't show up on any vessel tracker. The stats and the ships both describe motion. The problem, most weeks, is the stuff that isn't moving.
A few months back we were looking at a mid-sized gateway terminal, one of the kind where a single delayed reefer plug or a labor slowdown on one shift ripples through the whole yard plan for days. The question on the table was simple: is the congestion everyone's complaining about actually a space problem, or is it a handling-rate problem dressed up as one? Dwell time data from the TOS said utilization was running high but not alarming. Drivers waiting at the gate said otherwise. Someone needed a count that didn't depend on either system being right.
What settled it wasn't a new report from the port authority, since the next one wasn't due for another three weeks. It was a box count pulled from overhead imagery, block by block, the kind of thing that normally takes a walk-around with a clipboard or doesn't get done at all because nobody has four hours spare to do it properly. The count showed two blocks running near capacity and the rest of the yard sitting comfortably under it. The real issue wasn't a capacity crisis: it was a stacking pattern that had drifted because empties weren't getting cleared from the blocks closest to the apron, so everything downstream of that was absorbing the squeeze.
That's a small, almost boring finding. It's also the kind of thing you can act on the same afternoon, instead of waiting for a monthly number that would have confirmed the congestion three weeks after it started clearing itself up anyway.
The pattern repeats more than it should. Official stats answer "how busy were we." Analysts increasingly need to answer "how busy are we right now, in this block, today." Those are different questions and they call for different data, not a faster version of the same monthly release. A count taken from the imagery itself, bay by bay, sidesteps the lag entirely because it's reading what's physically there rather than waiting on someone to compile it.
If you're the one fielding the Tuesday phone call, that's really the whole argument for building this kind of read into a weekly routine rather than reaching for it only when a crisis forces the question. A daily box count by block and bay, pulled from the imagery itself doesn't replace the monthly throughput figures. It just stops you from needing to guess what they'll say three weeks before they say it.
Most congestion stories turn out to be stacking stories once you look at the yard directly. Worth checking before the next one gets blamed on the wrong thing.