AIS vs satellite imagery for measuring port congestion
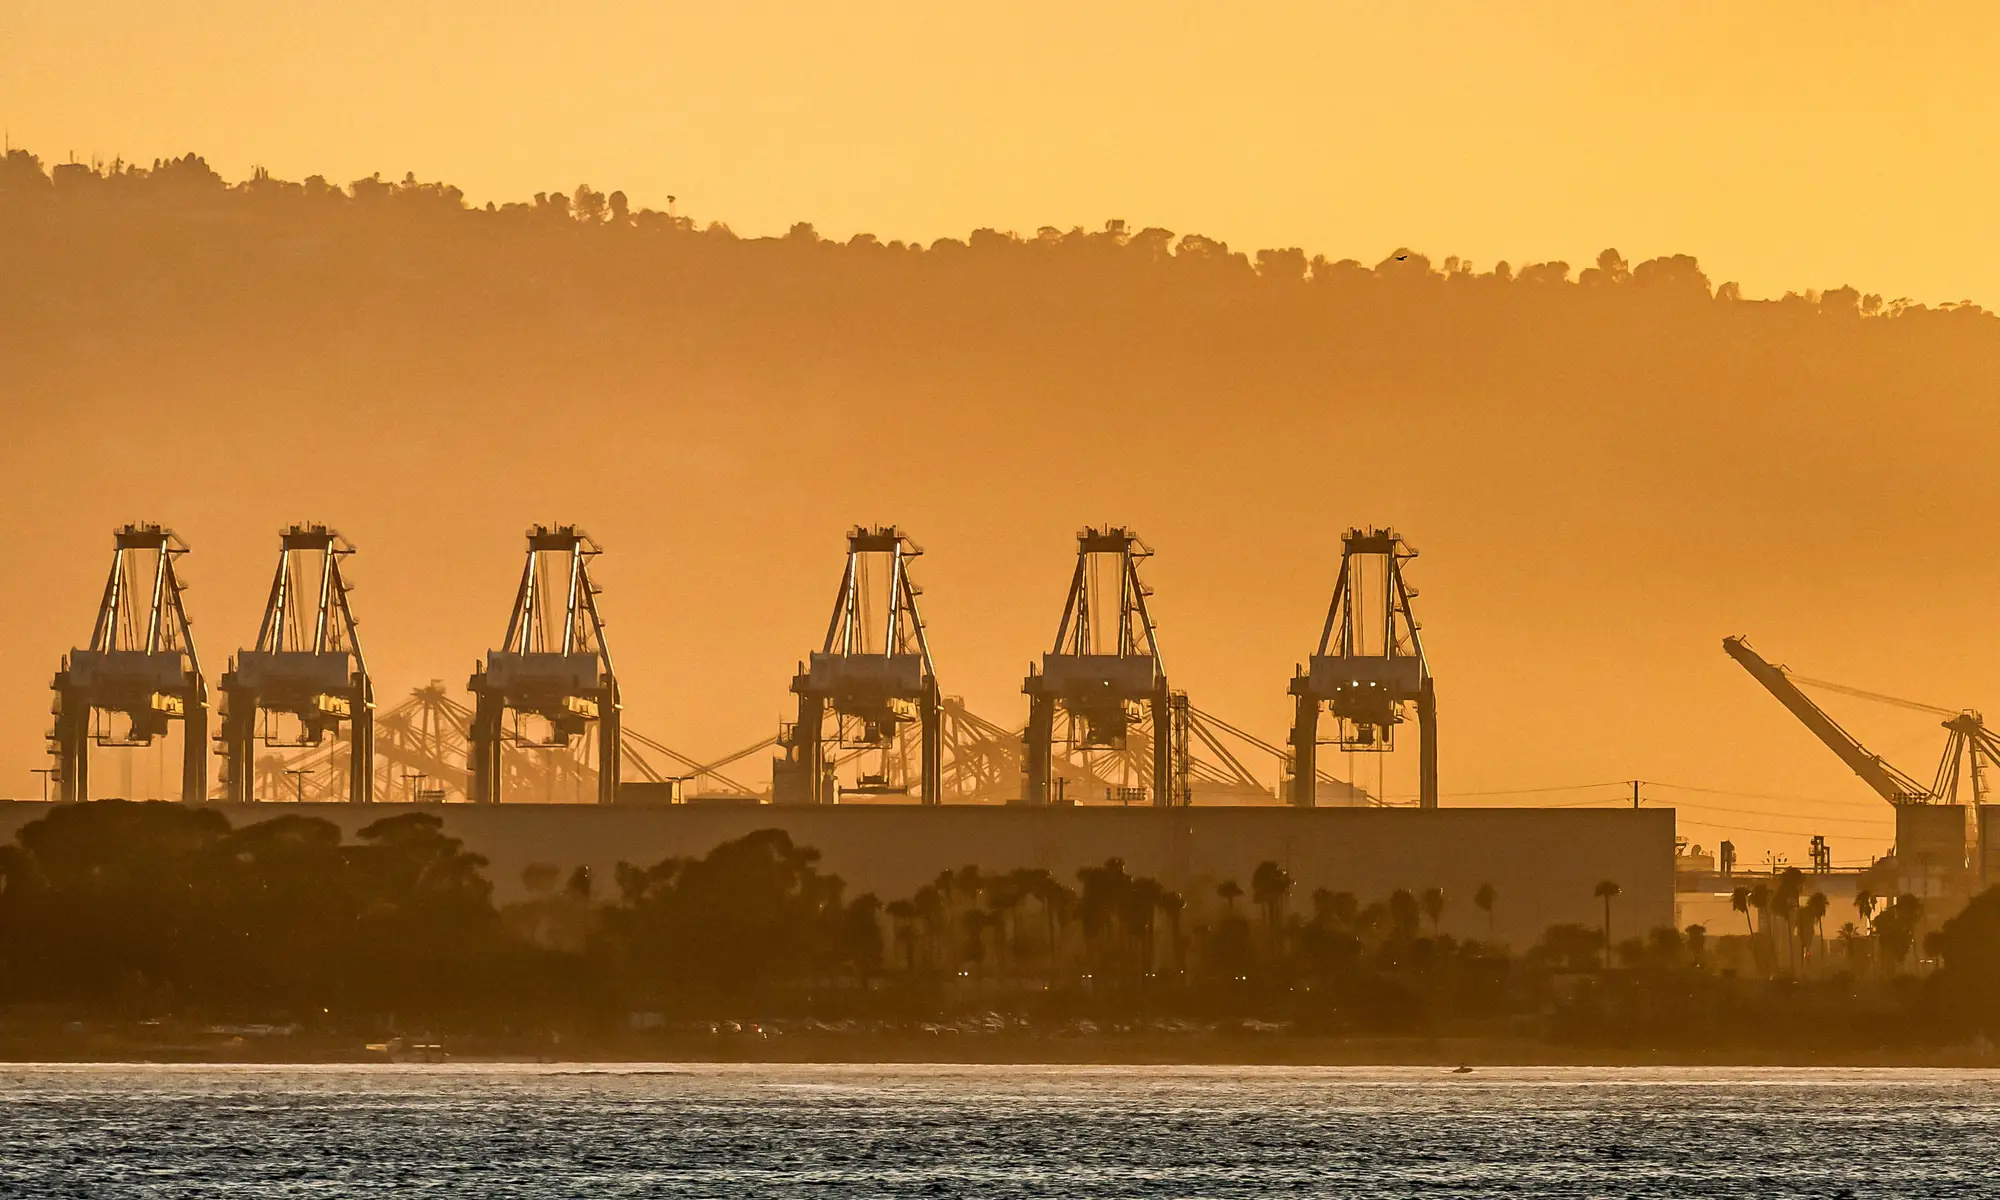
AIS tells you where a ship is. It doesn't tell you what's happening on the quay once that ship ties up, and for a terminal capacity analyst trying to read congestion in real time, that gap is where most of the guesswork lives.
What AIS measures
AIS is a vessel tracking system. Every ship over a certain size broadcasts its position, speed, and heading, and that signal gets picked up by coastal receivers and satellites and resold as a feed. It's genuinely useful for knowing which ships are approaching a port, how long they've been loitering offshore, and roughly how many vessels are queued outside the breakwater waiting for a berth.
What it can't do is tell you anything about the yard. AIS has no visibility into how many boxes are stacked on a given block, whether a bay is running at 60% or 95% of capacity, or how fast a terminal is turning containers once a vessel is alongside. A ship can sit at berth for eighteen hours with cranes idle because the yard behind it is jammed, and AIS will show you a perfectly normal-looking vessel call. The congestion is real, but it's invisible to a system built to track hulls, not stacks.
There's also a reporting lag problem. AIS positions can be patchy in congested anchorages, where vessels are packed close together and signals overlap or get masked by larger ships. Dark periods near busy ports aren't unusual. So even the one thing AIS is good at, counting ships waiting, gets noisier exactly where you need it most.
Where AIS falls short on yard congestion
Yard congestion comes down to a box count: how full is Block 4, is the reefer row at capacity, has empty storage backed up into the working area. Answering any of those means counting containers stacked on the ground, and AIS has no sensor for that. It was never designed to.
Some terminals try to proxy yard congestion from gate moves or TEU throughput figures, but those are usually monthly or quarterly releases from the port authority, published weeks after the fact. By the time the official statistics land, the congestion event they describe has often already cleared. For an analyst trying to flag a build-up before it turns into berth delays and demurrage disputes, a lagging indicator isn't much better than no indicator.
Tracking berth queues and yard fill without AIS
Very-high-resolution satellite and aerial imagery gives you a direct count instead of a proxy. Each pass over the terminal shows the boxes actually stacked on the quay and in the yard, bay by bay, which means you can see block-level fill levels the same day the imagery is captured rather than waiting on a monthly bulletin. That's a different kind of signal than AIS: it doesn't tell you where ships are, it tells you what's sitting on the ground, which is the half of the congestion picture AIS was never built to cover.
Used alongside an AIS feed, this gives you both halves of the picture: vessels queued outside, and box counts inside the fence. One without the other leaves a blind spot. A terminal can look clear on AIS while its yard is packed to the point that incoming vessels can't be worked efficiently, or a yard can have room to spare while ships stack up offshore for reasons that have nothing to do with capacity.
For planning teams that need a day-level read rather than a monthly one, Container Counting turns that imagery into a box count per block and bay, exportable as CSV or a map layer, refreshed daily. If AIS has been your only congestion signal, it's worth adding a yard-side count to see what it's been missing.